Contact Us (02) 9388 1741
Eliminate Monitoring Blind Spots

Eliminate Monitoring Blind Spots

Why SNMP polling misses microbursts, and how DANZ combined with LANZ delivers nanosecond-level visibility directly from the switches carrying production traffic.

Talk to a Specialist

SNMP polling at 1 to 5 minute intervals captures time-averaged interface utilisation statistics that hide the congestion events that cause application tail latency and packet drops. A micro-burst that fills a switch queue to capacity and triggers packet loss in 200 microseconds leaves no trace in a 5-minute average utilisation graph: the average utilisation may be 30% during an interval that contained a congestion event that caused 1,000 packets to be dropped. When a network operations team investigates an application performance complaint that correlates with the 200-microsecond burst, SNMP statistics provide no evidence that any network event occurred, directing investigation toward application servers or end-user equipment rather than the switch queue where the actual packet loss occurred. The visibility gap exists not because the network lacks telemetry hardware, but because traditional monitoring approaches collect telemetry at intervals many orders of magnitude longer than the timescales at which congestion events occur.

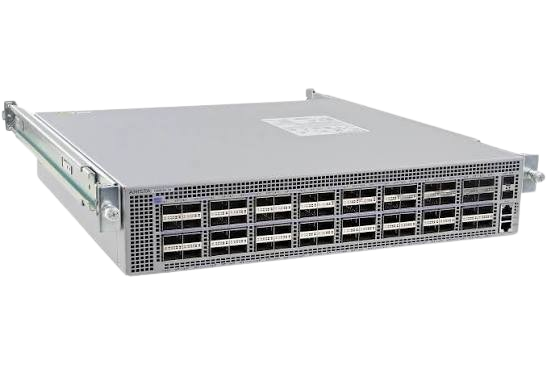
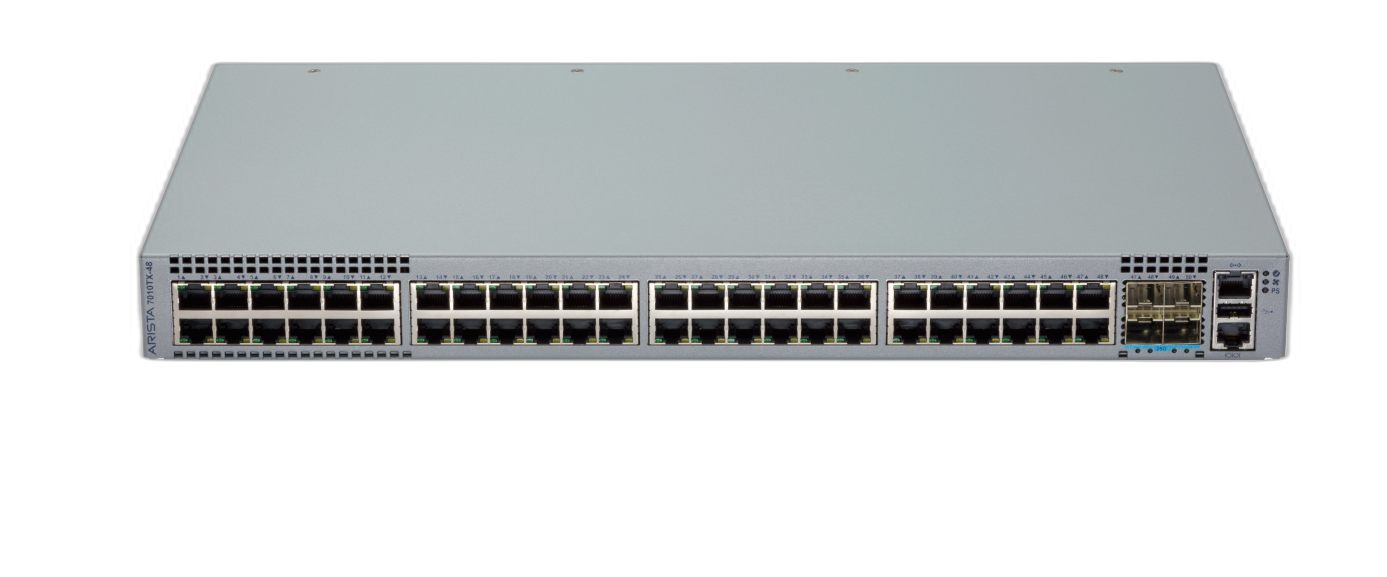
Arista LANZ (Latency Analyzer) captures queue depth and latency at nanosecond precision from every switch buffer in EOS hardware, recording the peak occupancy and duration of each congestion event and streaming that data to CloudVision in real time, without requiring external probe hardware, external tap infrastructure, or separate monitoring appliances. Because LANZ is part of EOS and runs on every Arista switch, the telemetry is available uniformly across all fabric tiers using the same API and data schema. DANZ (Data Analyzer) extends this visibility to include packet-level TAP aggregation for deep inspection and continuous capture, providing the capture infrastructure for security forensics and compliance use cases where historical packet data is required. The 7010X achieves 296 Gbps and 220 Mpps at under 0.3W per Gbps, and the 7260X3 provides 12.8 Tbps in 2RU with a 64 MB dynamic shared buffer and 9.5 Bpps, both instruments for LANZ monitoring. EOS live patching and stateful fault containment keep the monitoring software running without maintenance-window disruptions.

Nanosecond Buffer Telemetry with LANZ

LANZ instruments each hardware queue at nanosecond timing resolution, recording the timestamp, peak depth, and duration of every congestion event that occurs on each queue, regardless of how brief that event is. A 200-microsecond burst that drives a queue to 80% occupancy and triggers ECN marking is recorded as a discrete event with a precise timestamp, enabling an operations team to correlate it with an application performance complaint that occurred at the same timestamp. The LANZ data stream is available in CloudVision and via the EOS streaming API, meaning the nanosecond-precision telemetry integrates with any analytics or observability platform that can consume the EOS gNMI telemetry stream; there is no proprietary collection agent required between the switch and the analytics system.

Built-In Visibility, No Dedicated Probe Hardware

LANZ and DANZ telemetry are generated by EOS running on the same switch ASIC that forwards production traffic; there is no separate monitoring NIC, no external probe device, and no per-port mirror that consumes forwarding capacity to generate telemetry. Traditional packet-level visibility approaches that mirror traffic to dedicated monitoring ports consume forwarding bandwidth proportional to the traffic volume being monitored: monitoring 100G of traffic requires a 100G mirror port, and the cost of monitoring scales with the traffic volume. LANZ provides buffer-level visibility at the granularity required to detect micro-burst congestion without consuming any forwarding port capacity for telemetry collection. DANZ TAP aggregation for packet capture uses dedicated TAP interfaces rather than mirroring production ports, preserving the forwarding capacity of all production ports.

DANZ Continuous Packet Capture

DANZ (Data Analyzer) provides packet-level TAP aggregation and continuous capture infrastructure for deep packet inspection and security forensics. A continuous packet capture capability, one that records all traffic on monitored segments and retains it for a configurable retention window, supports security incident investigation by providing the network-level evidence required to reconstruct the sequence of events in a breach: which hosts communicated, what data was transferred, and which lateral movement paths were taken. DANZ on Arista switches aggregates TAP feeds from multiple network segments in a single chassis, reducing the number of capture appliances and the complexity of the capture topology compared to separate TAP aggregators per segment. Captured traffic is available for analysis by any network packet broker or security analytics tool that accepts PCAP or streaming packet data.

Power-Efficient High-Capacity Platforms

The 7010X achieves under 0.3W per Gbps for 1/10/25G server-tier monitoring. At 7W per 100G port, a large server access fabric can be fully instrumented with LANZ at a power cost that is negligible compared to the compute infrastructure it monitors. The 7260X3 at 12.8 Tbps in 2RU with a 64 MB buffer and 9.5 billion packets per second provides spine-tier LANZ instrumentation at the throughput scale of the largest data centre fabrics, with the deep buffer required to observe the transient congestion events that occur at that scale without artificially triggering drops from the instrumentation. At under 7W per 100G port at the spine tier, the monitoring capability does not materially increase the power draw of the fabric compared to a non-monitored deployment; the visibility is close to cost-free from a power envelope perspective.

Technical Specifications

Full specifications for Eliminate Monitoring Blind Spots

Detailed specifications are coming soon — see the datasheet in the Documentation tab for full details in the meantime.

Documentation

Download product documentation and resources

Product Datasheet

Eliminate Monitoring Blind Spots Datasheet

Your browser doesn't support inline PDF preview. Download the datasheet instead.

Call a Specialist
Today!

Our team of experts is ready to help you find the perfect solution for your business needs. Get personalized advice and competitive quotes.

Monday - Friday: 9:00 AM - 6:00 PM AEST
Sydney, Australia

Speak to an Expert

We're here to help with any questions

Call us now
(02) 9388 1741